Quantitative MR methods in clinical and basic neuroscience
Introduction
Quantitative MR means turning an MR scanner (the happy snappy camera of the radiologists) into am instrument for quantitative measurements (for the curious MR physicists) to determine volumes, concentrations of metabolites and contrast agents and the biophysical properties of tissue. The latter are presented as “parameter” maps, which are calculated from primary MR images. Quantitative MR requires detailed knowledge of how the MR signal is processed by the scanner and often uses additional QA measurements to monitor how well the scanner hardware is adjusted to individual anatomy (e.g. mapping the flip angle).
Quantitative data thus obtained is reproducible (within errors) and thus preferred in clinical MR studies to compare different groups (cross-sectional) or to follow-up patients or healthy development over time (longitudinal). The credo is that qMRI is more specific to detect or describe changes in the tissue.
MP2RAGE
Normalized MP-RAGE (MP2RAGE) is a popular method to achieve uniform, semi-quantitative, purely T1-weighted images at 7T. Maps of T1 can be derived from the uniform images. An established high-resolution protocol (Fig. 1) has been transferred to the 7T Philips Achieva system and accelerated from 11 mins to 8 mins using the same partial acquisition factors.
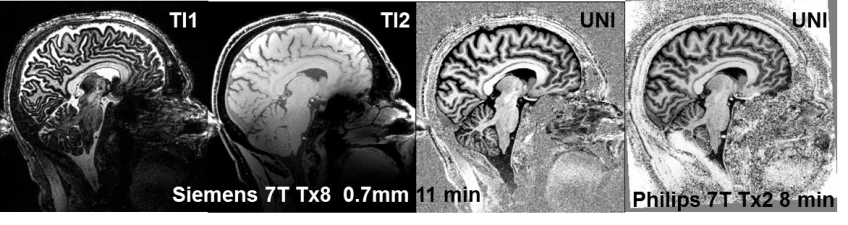
Figure 1: MP2RAGE at 7T .Two images of a 52 year old male obtained at short (TI1) and long (TI2). These yield a uniform purely T1-weighted image (UNI). Bright areas on Philips are due to low TxRx of the dual Tx coil.
Multi-parameter mapping based on spoiled gradient echo MRI
MRI using spoiled gradient echoes (Fast Low Angle Shot; FLASH) was established in the mid 80’s to provide fast high-resolution images in two and three dimensions. The contrast FLASH images is very versatile, ranging from proton density (PD) to T1-weighted (by flip angle and TR), with additional weighting by T2* and susceptibility (by TE) or magnetization transfer (MT; by additional MT-pulses). Parameter maps of T1, T2*, MT and PD) can thus be estimated from multi-echo 3D FLASH (as illustrated below in Fig. 2). We have participated in developing the SPM-based hMRI toolbox.
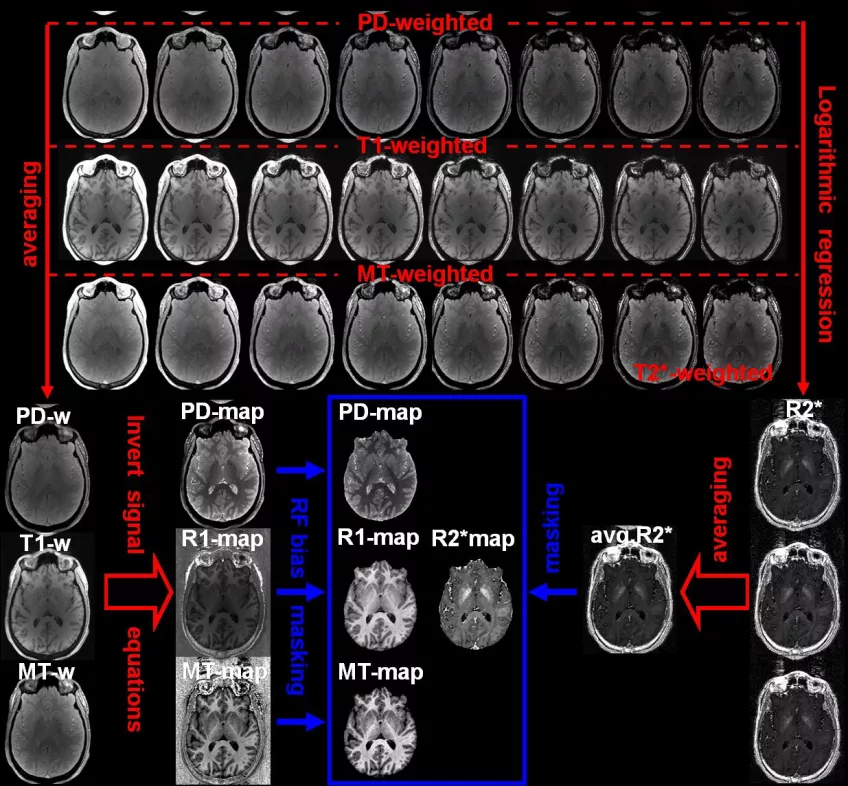
Figure 2: Processing scheme of FLASH-based multi-parameter mapping (MPM).Three trains of gradient echoes are acquired with predominant PD-, T1-, and MT weighting. These yield R2* maps by logarithmic regression over TE and averaged images (at mean TE). The latter yield maps of PD, R1, and MT. Note that the estimation of R1 and PD requires mapping the B1 fields in transmit (B1+) and receive (B1–). This is performed by the hMRI toolbox.
We are now establishing multi-parameter mapping (MPM) on the 7T Philips Achieva of National 7T Facility, where a higher image resolution can be achieved than on clinical MR scanner.
Arguably, MT maps and R2*(=1/T2*) maps are most important because they represent invisible structural material (including myelin) and cellular iron. They can be used as surrogate concentration for these important sources of MR contrast in brain without further correction. The animated Fig. 3 shows a structural MT-maps and an R2*-maps of a healthy subject acquired with 0.8 mm resolution at 3 Tesla.
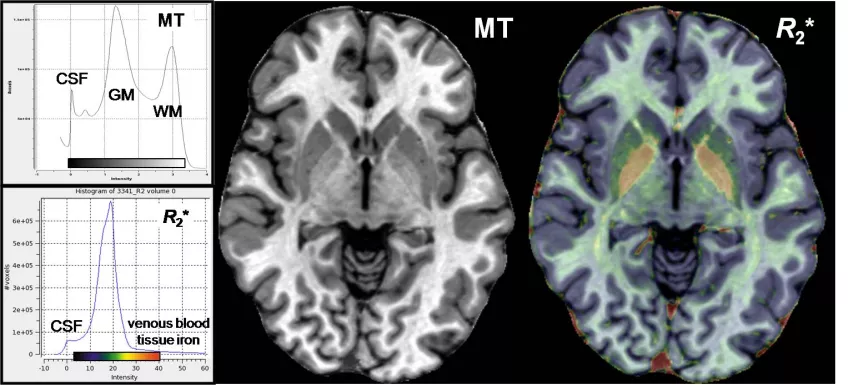
Figure 3: Structural MT-maps and iron R2*-maps of healthy brain at 0.8 mm resolution. The MT map (left; traditional grayscale) show a high GM-WM contrast, especially in basalganglia. The R2*maps (right, semi-transparent ACTC overlay) highlights non-heme iron in the extra-pyramidal motor system and heme iron in the larger draining veins, besides minor differences of some major axonal tracts in white matter.
Quantitative susceptibility mapping (qSM) and R2* mapping
The bipolar gradient-echo read-out of the MPM protocol is SNR-efficient and low in peripheral nerve stimulation (PNS). The phase images can be directly converted into maps of the local B0 field, from which the magnetic susceptibility can be estimated. It is increased by iron and decreased by fatty substances such as myelin, and thus, a complement to R2*, which is increased by both myelin and iron. (Fig. 4). qSM evaluation of 7T Philips Achieva data was optimized in collaboration with J. Acosta-Cabronero, WTCN, London. Hence, we recommend using his multi-scale dipole inversion (MSDI) algorithm for analyzing multi-echo phase data.
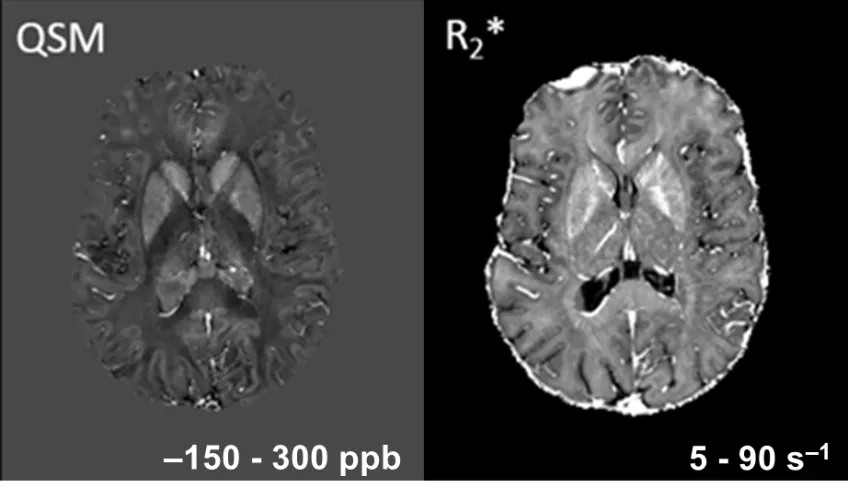
Figure 4: qSM and R2*-mapping of healthy brain at 7T. The 7T qSM map (left) shows crisper structures than the R2* map (right) since the blooming of the B0 field is removed by deconvolution. The different GM-WM contrast is explained by subtractive and additive contribution of myelin, respectively.
Multi-echo GraSE-based mapping of multi-component T2 at 1.5T and 7T
3D T2 mapping is considerably accelerated by using straddling gradient echoes (GraSE) for phase encoding. Imperfections of the flip angle lead to stimulated echoes, which have to be accounted for by an extended phase graph algorithm. Thus, T2-based mapping yield maps of the short-lived myelin water fraction (MWF) (Fig. 5). 1.5mm isotropic resolution can be sampled at 1.5T in about 10 minutes. At 7T, the apparently shorter T2 requires adjustment of the T2 grid and cut-off threshold to obtain MWF maps consistent to 3T.
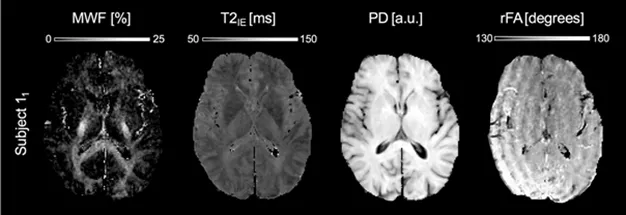
Figure 5: Myelin-water fraction mapping of healthy brain at 1.5T. The MWF map (left) obtained at 1.5T at 1.25x1.25x2mm resolution as estimated using the MERA toolbox. Note, that the EPN algorithm sorts gradient imperfections into effective flip angle map.
Mapping the intracellular fraction by UTE sodium MRI
Sodium (Na) MRI greatly benefits from ultra-high field strength because of its low sensitivity. At finite of ~4ms, the sodium signal in brain is mostly originating from extra-cellular space due to the Na/K pumps and long T2. Ultra-short TE (UTE) MRI measures even the short T2 (<2ms) intracellular Na signal. In combination with trailing gradient echoes, the excess of intracellular Na can be mapped at a resolution of 3.5 mm within 12 minutes.
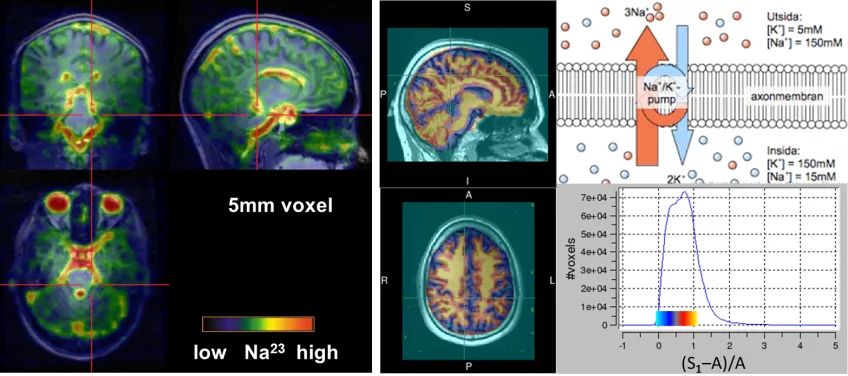
Figure 6: Na MRI of the brain to map the excess of intracellular sodium.Total UTE sodium signal (S1) originates mostly from CSF and ECS (left). When the long-lived signal amplitude (A) is estimated by gradient-echoes, the intracellular fraction (middle) can be mapped. Na MRI displayed as transparent overlays on T1-w 1H MRI for anatomical reference.
Proton MR Spectroscopy
Non-exchangeable protons in small mobile molecules have a slightly different Larmor frequency than water (±5 ppm). Such MR spectra can be acquired in vivo from a localized region (MR spectroscopy; MRS) to analyze by specialized software (e.g. LCModel) to provide the tissue concentrations of about 20 neuro-metabolites. Since the sensitivity and/or resolution of in vivo MRS benefits from high magnetic field strength, we are establishing MRS techniques at the Swedish National 7T Facility (Fig. 7).
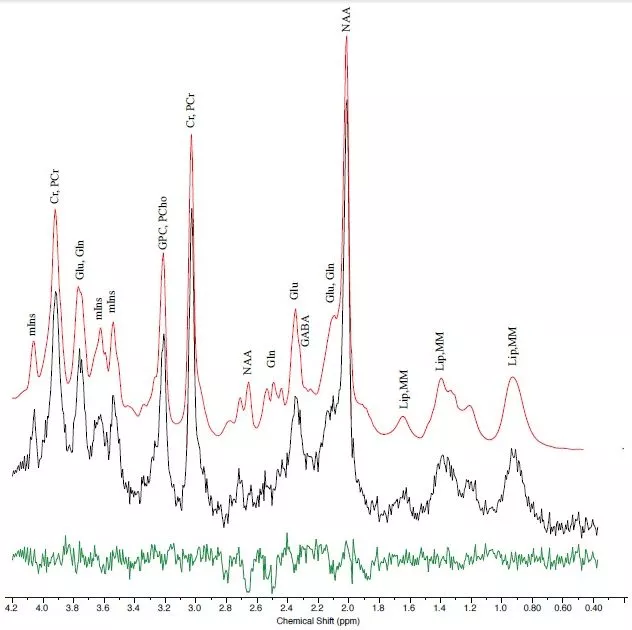
Figure 7: LCmodel analysis of 7T proton MR spectrum. 8 ms localized in occipital cortex using a semiLASER sequence (TE/TR/NAS=30 ms/4s/32). Fit of metabolite signal (red) to spectrum (black) with residues (green) (courtesy of S. Cuellar-Baena).
Quantitative MR
Group Leader
Gunther Helms, Ph.D.
Associate Professor
e-mail: gunther [dot] helms [at] med [dot] lu [dot] se (gunther[dot]helms[at]med[dot]lu[dot]se)
LU research portal profile: Gunther Helms

Doctoral Students
Hampus Olsson, M.Sc.
e-mail: hampus [dot] olsson [at] med [dot] lu [dot] se (hampus[dot]olsson[at]med[dot]lu[dot]se)
LU research portal profile: Hampus Olsson